Visualization Tools
The TooAngel bot includes comprehensive visualization tools for debugging room layouts, creep behavior, and performance metrics.
Room Layout Visualization
Enable Visualization
Add to your config_local.js:
config.visualizer.enabled = true;
Visualization Options
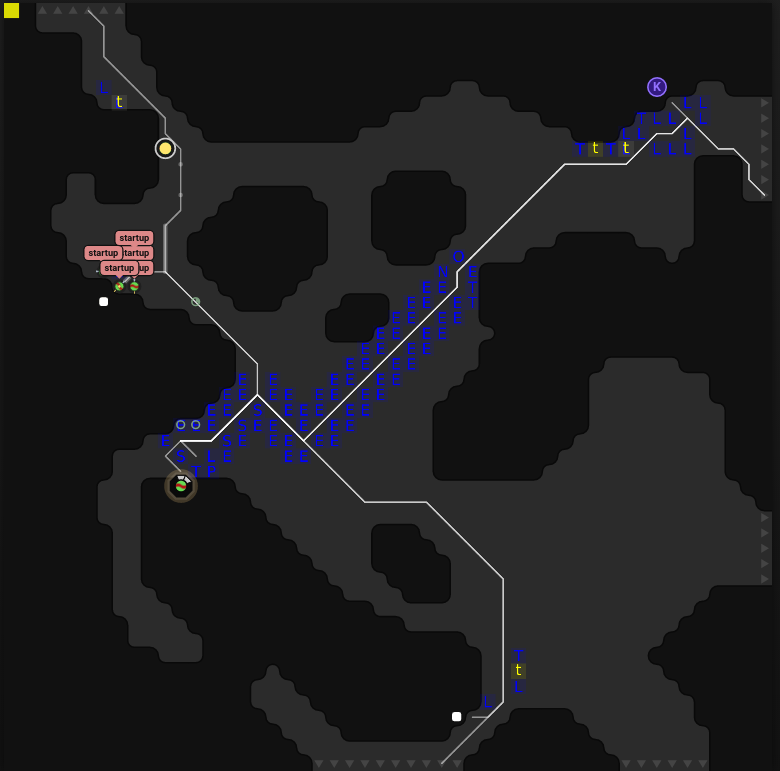
The visualizer provides multiple overlay modes to help debug different aspects of the bot:
showRoomPaths- Displays the fixed pathfinding routes used throughout the roomshowCreepPaths- Shows individual creep movement paths in red for tracking behaviorshowPathSearches- Visualizes results fromPathFinder.searchoperationsshowStructures- Highlights planned and existing structure positionsshowCreeps- Shows positions of creeps with fixed assignmentsshowBlockers- Displays walls, ramparts, and other movement obstaclesshowCostMatrices- Shows the stored pathfinding cost matrices
Configuration: Default values for these options are defined in config.js and can be overridden in config_local.js.
Room Data Dashboard
Default Display
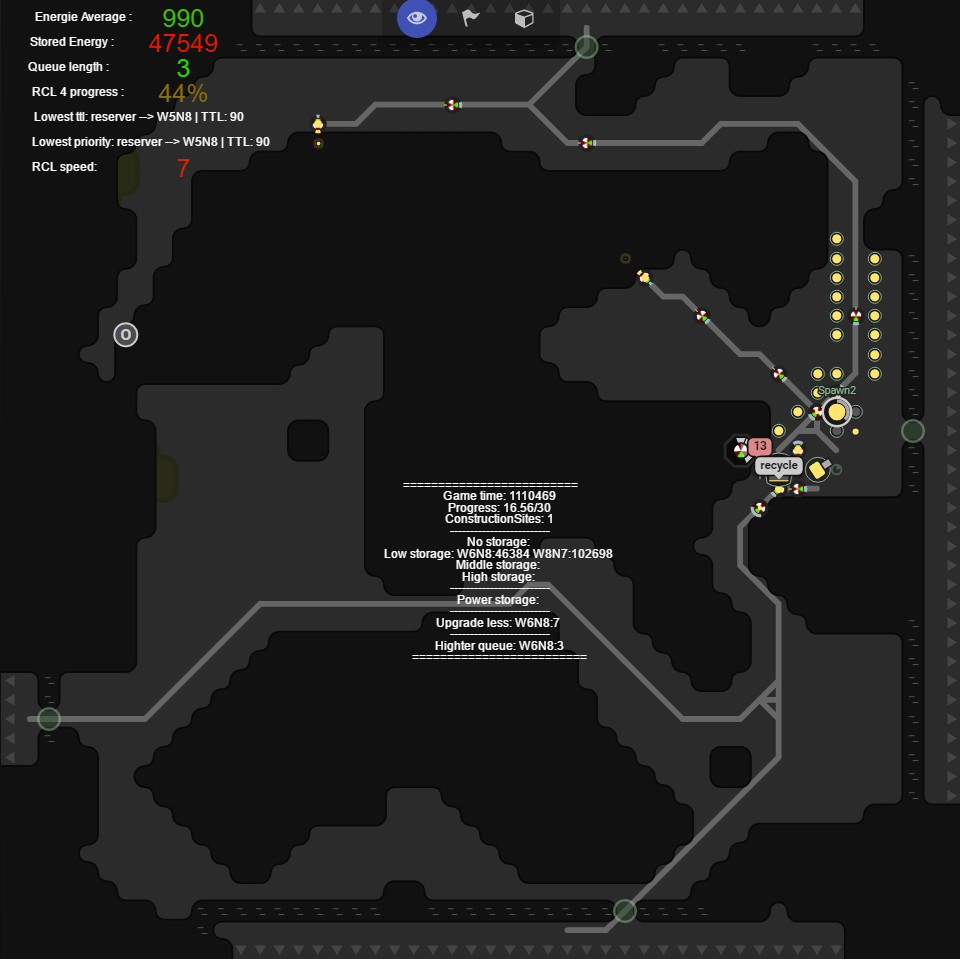
The room data visualization shows essential metrics for the currently selected room:
- Energy Average - Historical energy production and consumption trends
- Energy Stored - Current energy reserves in storage and containers
- Queue Length - Number of creeps waiting to spawn
- RCL Progress - Room Control Level advancement status
- Creep Queue Details - Minimum TTL and priority information for queued creeps
Extended Metrics
Enable comprehensive data display by adding to your configuration:
config.summary.enabled = true;
After enabling, wait for the next summary cycle to see additional metrics including:
- Resource production rates
- Market activity
- Combat statistics
- Performance indicators
- Memory usage patterns
Usage Tips
- Use visualization during development to understand bot behavior
- Enable specific overlays when debugging particular issues
- Room data helps optimize spawn timing and resource management
- Performance overlays help identify CPU bottlenecks